Case study · 2026
FishMAT
A web app that helps fisheries teams turn catch records into a picture of how a fishery is doing, and into reports they can share.
- Context
- My role at Rare
- Role
- Lead developer
- Stack
- ReactTypeScriptViteTailwind CSSPythonFastAPIPostgreSQLPostGISClaudeRender
What it does
FishMAT, the Fisheries Management Assessment Tool, is a private web app at fishmat.org. It helps fisheries teams turn catch records into a clear picture of how a fishery is doing, and into reports they can share.
Teams upload spreadsheets, or connect a live source such as KoboToolbox so new landings arrive on a schedule. The app checks the file, suggests which column is which, and updates existing records on a later import instead of duplicating them. Species details are filled in from FishBase when they are missing.
Catch is tied to a hierarchy of country, province, municipality, and community. Sites can be placed on a map, marked public or private, and merged when the same place was entered twice.
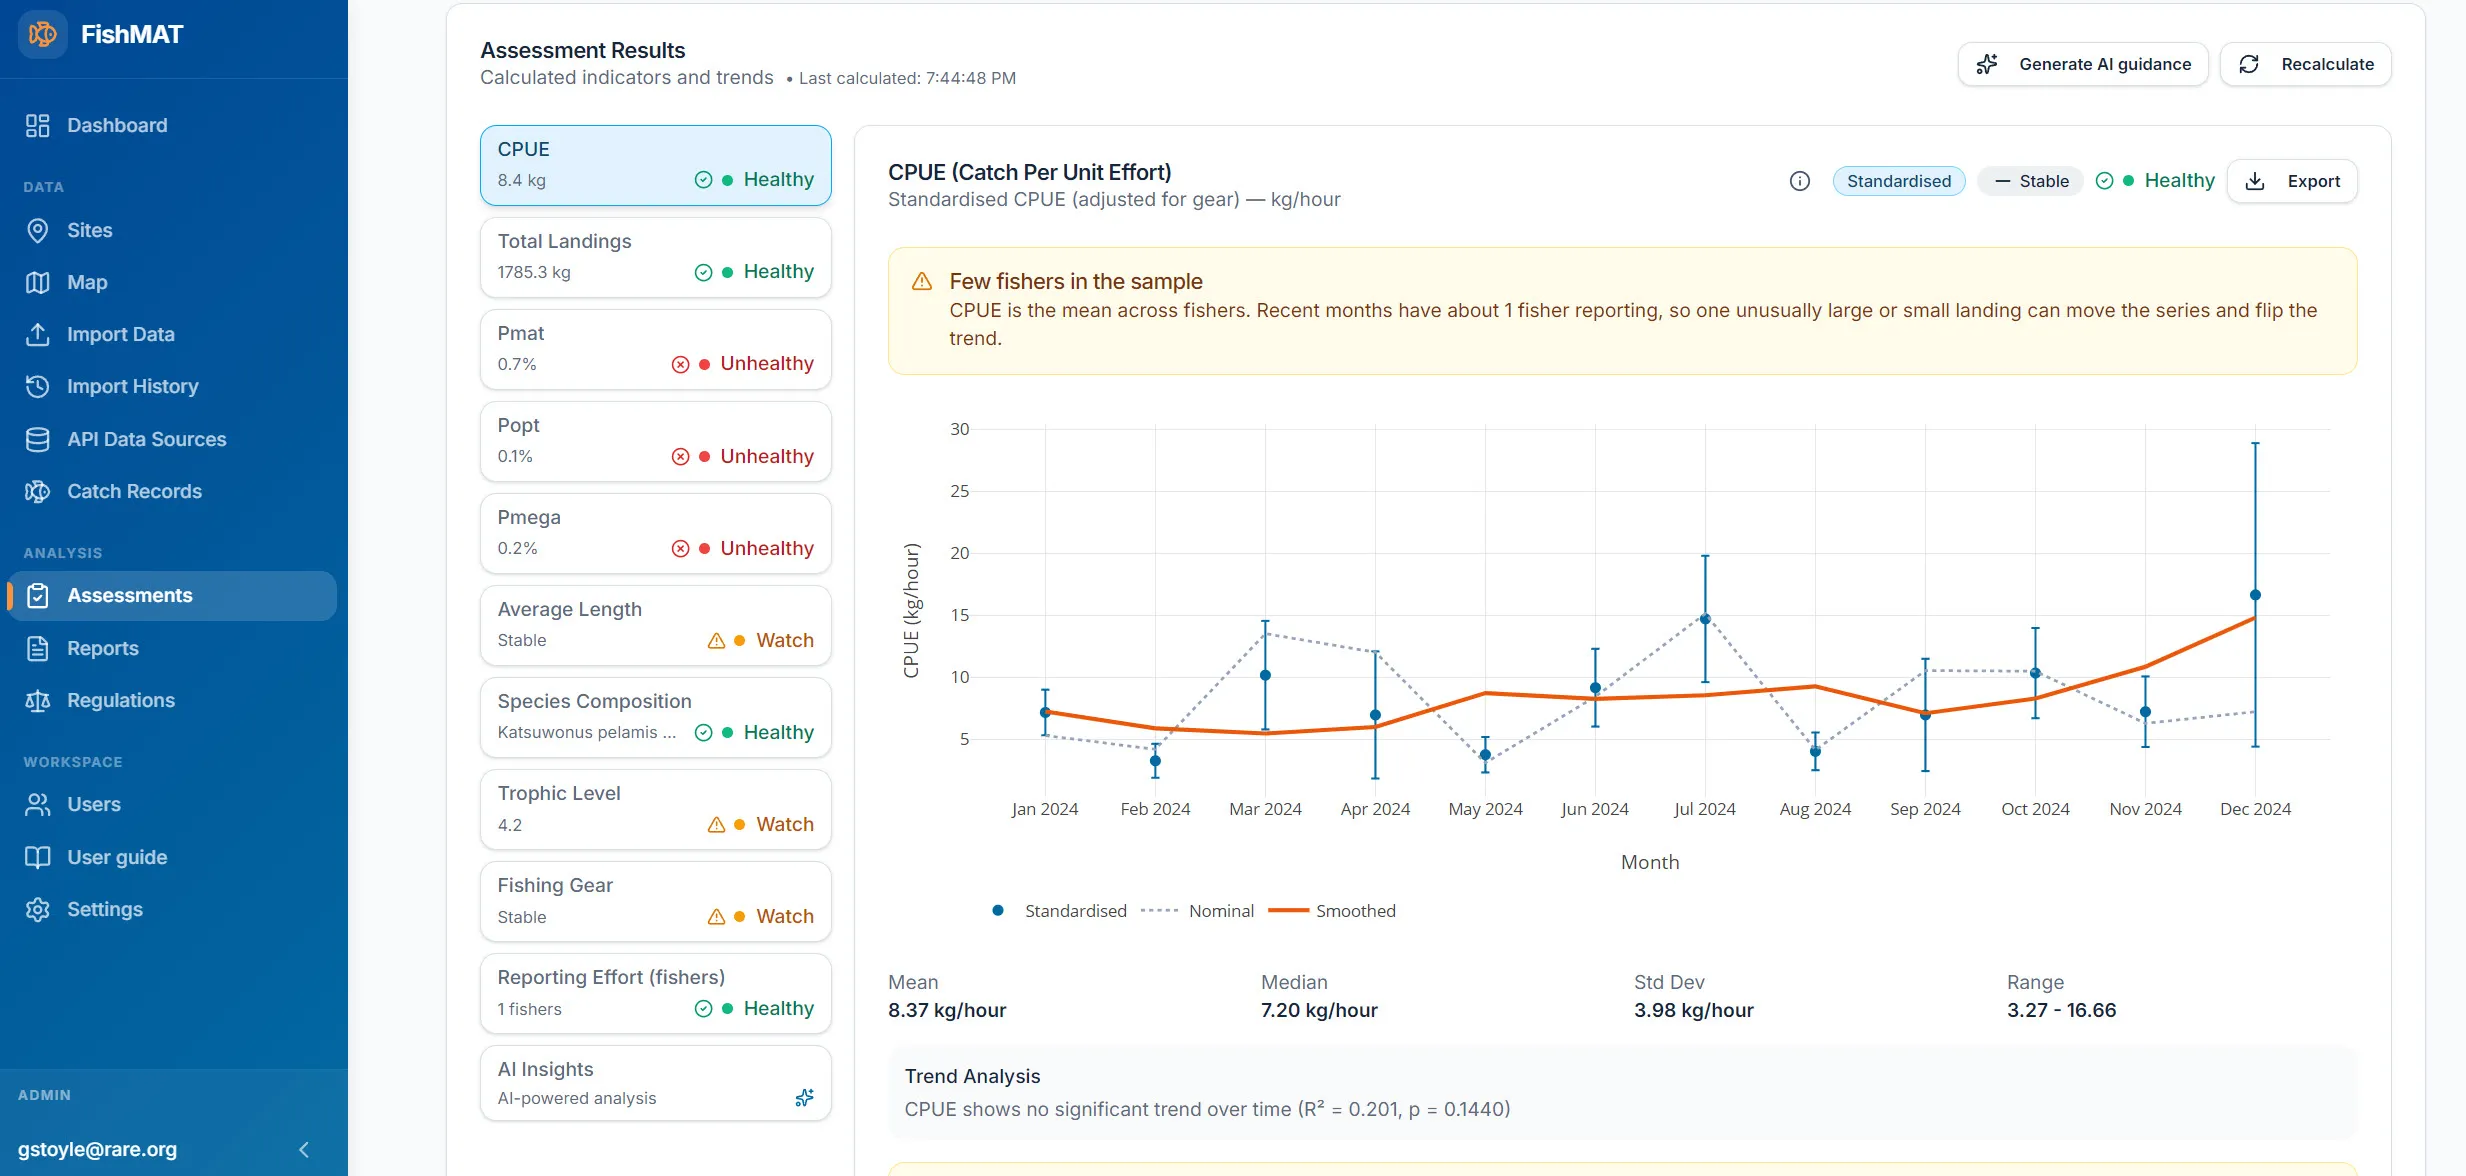
An assessment calculates standard indicators for a chosen place and time: how much fish is caught for the effort spent, total landings, which species make up the catch, and whether fish appear to be caught at a healthy size. Charts show whether those measures are rising or falling, and flag when the data is too thin to trust.
Teams record community consultations and the regulations that follow. They can generate a written report, with an optional AI narrative, and download it as a PDF. Partners can also pull catch totals into Excel, Google Sheets, or Power BI without seeing fisher names, boats, or prices.
Access is by invitation. People see only the sites and actions their role allows.
Why it matters
Small scale fisheries decisions are often made from scattered spreadsheets and specialist analysis that most field teams cannot run themselves. FishMAT puts the same indicators, site context, consultation record, and shareable report in one place, so managers can see trends and explain them to communities and partners without a separate statistics package.
How I built it
FishMAT started as an R Shiny app, and I rebuilt it as a full web application. TODO: add why you rebuilt it and what was hardest.
On the live site, scheduled data syncs run inside the API. Redis, Celery, and MinIO are part of the local development setup and are not running in production.
Technical detail
- Interface: React 19, TypeScript, Vite, and Tailwind CSS.
- Server: Python 3.11 and FastAPI, hosted on Render with the website.
- Database: PostgreSQL 16 with PostGIS for maps and pgvector, on DigitalOcean. Schema changes go through SQLAlchemy and Alembic.
- AI: Claude, for column mapping suggestions and report narratives.
- Local development uses Docker, Redis, Celery, and MinIO. In production those three are not running. Scheduled syncs run inside the API.