Case study · 2025 to 2026
Climate Change Vulnerability Assessment (CCVA)
The Climate Change Vulnerability Assessment (CCVA) platform lets governments, NGOs, community leaders, and funders see which coastal fishing areas are most at risk and what they might do about it.
- Context
- My role at Rare
- Role
- TODO: role
- Stack
- Next.jsReactTypeScriptTailwind CSSTanStack QueryZustandLeafletjsPDFFastAPIPythonSQLAlchemyAlembicPostgreSQLPostGISRedisAnthropic ClaudeRender
- 5
- Parts of the score, weighted equally
- 30+
- Variables for each area
- 5
- Countries on the explore list
What it does
CCVA is a way to answer who or what is most at risk if the climate keeps changing. The platform applies that to coastal managed access areas. It combines climate hazards, how easily nature and people are harmed, and how well a community can cope. Everything sits on a scale from 0 to 1, so places can be compared.
Someone can explore a map, open an area, read the variables, compare several places, and pick adaptation actions into a plan. Area reports can be downloaded as PDFs, including a written interpretation of the results. A methodology page explains the scoring. A user guide walks through the main tasks. A later community dashboard shows one area in plain language, with each variable marked as no risk, at risk, severe risk, or not assessed.
The explore list covers Brazil, Honduras, Indonesia, Mozambique, and the Philippines.
The site is explicit that this is a decision support tool. It is not a forecast, and it does not replace local knowledge.
Why it matters
Coastal fishing communities face hazards such as sea level rise, storms, and changes in fisheries, but a single indicator does not show the whole picture. The platform puts many indicators on one scale so practitioners can see patterns, ask better questions, and decide where action matters most. Actions in the library are tied to the variables they address, so a person looking at something like bleaching or access to credit can move straight to related responses.
How I built it
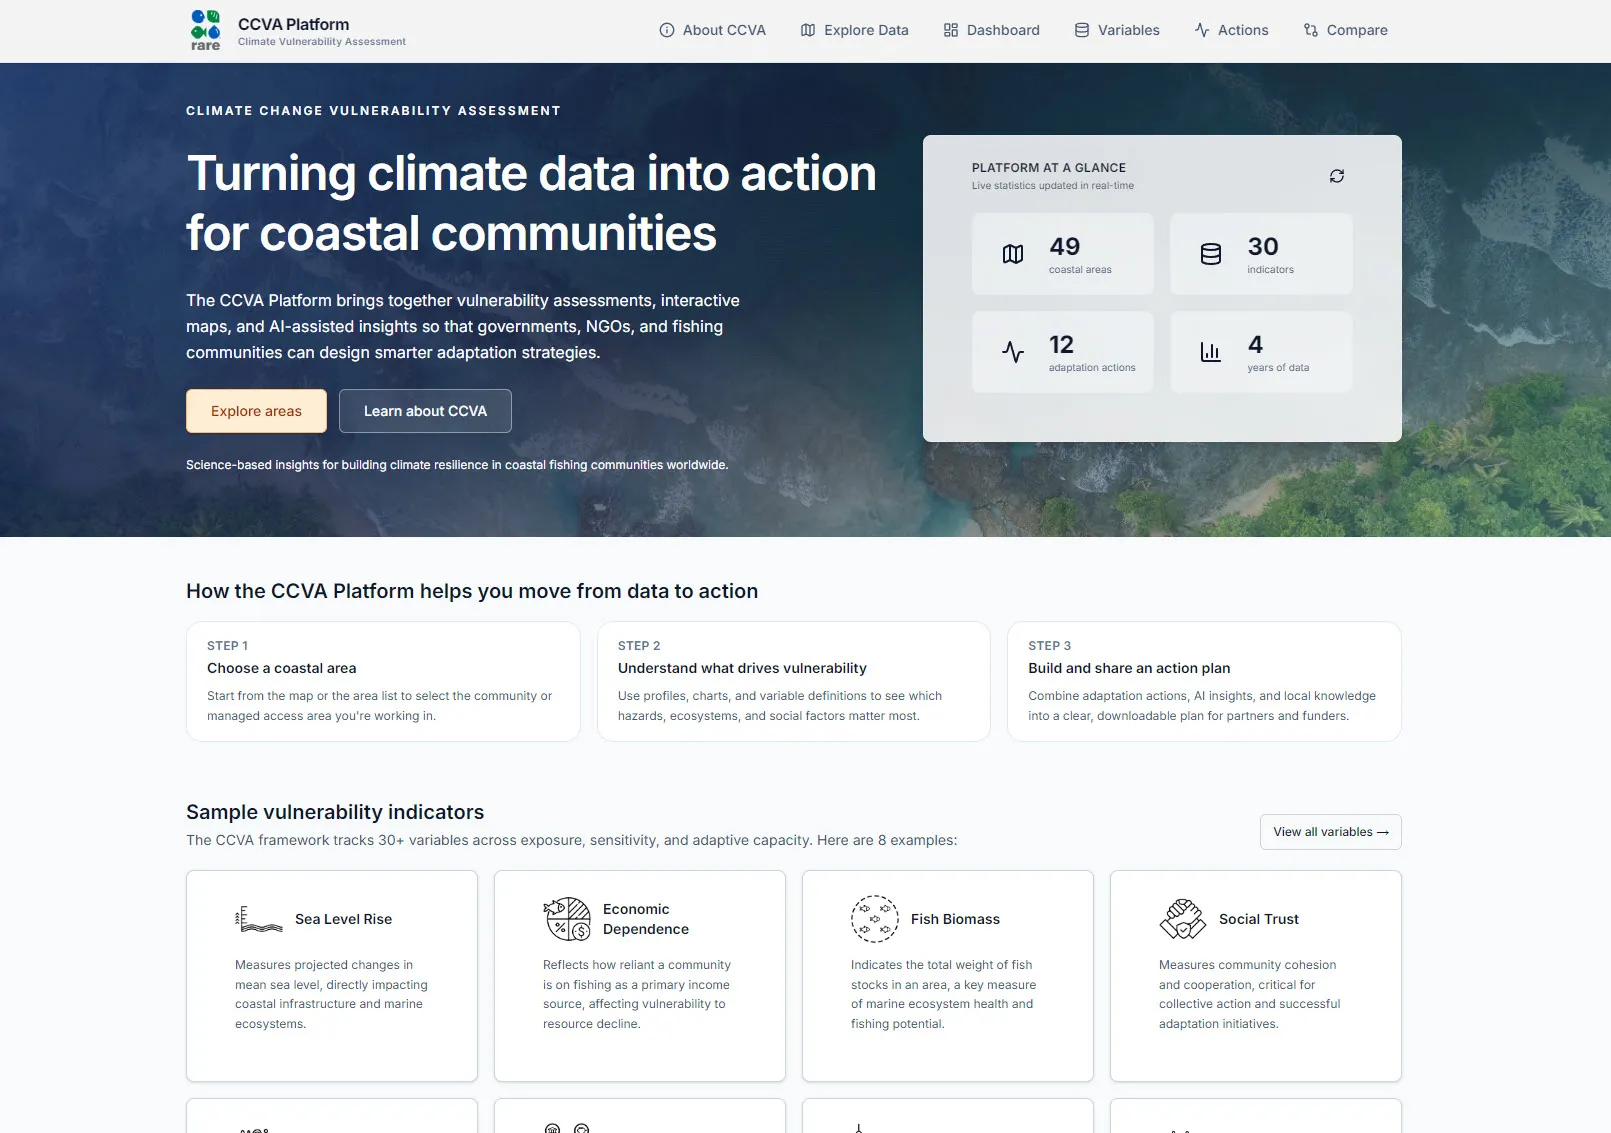
The first version, recorded as 10 November 2025, was a website and a data service: a map colored by vulnerability, area pages, a variable list, an action library, and charts for scores and trends. The database held places, scores, variables, actions, and the written insights.
Over the next two weeks I aligned the product with the official method. The score became exposure plus ecological and social sensitivity, minus ecological and social adaptive capacity, with each of the five parts at 20%. I added icons for the variables, a lighter map background, search, and hover popups so people could scan areas without leaving the map.
I then added PDF area reports, a homepage with the coastal photograph and summary numbers, a written user guide, and a methodology page that reads the component explanations from the database. The action library was reworked so each action points at the variable it relates to, and a selected set of actions can be saved as a plan.
In January 2026 I applied that same score in the data queries and made missing values show as “no data” instead of a misleading number. In September 2026 I added the community dashboard, documented it in the user guide, fixed a failed backend deploy, and connected the map to a CARTO key after the basemap started showing an “API key required” watermark.
Technical detail
- People use a website. It asks a separate Python service for data, and that service reads a PostgreSQL database with map shapes stored alongside the scores.
- The map draws each area from those shapes and colors it by its vulnerability score. The background map comes from CARTO.
- Scores are stored per variable and per assessment date. The overall score adds exposure and both kinds of sensitivity, then subtracts both kinds of adaptive capacity.
- A cache keeps repeated requests fast, and falls back to memory if the cache server is unavailable.
- An AI service writes a short interpretation for an area. Those notes appear on the area page and in the PDF report.
- The data service is deployed on Render. The map key has to be present when the website is built, or the basemap tiles still show the watermark.